共计 14295 个字符,预计需要花费 36 分钟才能阅读完成。
上次说到实现对 oss nas 监控,这次我们来实现 mongodb 副本级监控,
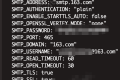
只需要写一个 mongodb 的 exporter
a# Use Python 3.10 to match the project runtime
ARG TARGETPLATFORM=linux/amd64
FROM --platform=$TARGETPLATFORM python:3.10-slim

# Ensure reliable Python runtime in containers
ARG http_proxy
ARG https_proxy
ARG ALL_PROXY

ENV PYTHONDONTWRITEBYTECODE=1 \
    PYTHONUNBUFFERED=1 \
    SERVER_HOST=0.0.0.0 \
    SERVER_PORT=8000 \
    METRICS_PATH=/metrics \
    http_proxy=${http_proxy} \
    https_proxy=${https_proxy} \
    ALL_PROXY=${ALL_PROXY} \
    HTTP_PROXY=${http_proxy} \
    HTTPS_PROXY=${https_proxy}

# App workdir
WORKDIR /app

# Install Python dependencies first (better layer caching)
COPY requirements.txt /app/requirements.txt
RUN pip install --no-cache-dir -r /app/requirements.txt

# Copy only runtime source code (exclude docs, tests, configs)
COPY main.py /app/main.py
COPY aliyun_client.py /app/aliyun_client.py
COPY prometheus_metrics.py /app/prometheus_metrics.py
COPY config.py /app/config.py

# Prometheus will scrape this port
EXPOSE 8000

# Default command: start exporter
CMD ["python", "main.py"]
mongodb granfa json 如下
{
"annotations": {
"list": [
{
"builtIn": 1,
"datasource": "-- Grafana --",
"enable": true,
"hide": true,
"iconColor": "rgba(0, 211, 255, 1)",
"name": "Annotations & Alerts",
"type": "dashboard"
}
]
},
"editable": true,
"gnetId": null,
"graphTooltip": 0,
"id": 94,
"iteration": 1777448539972,
"links": [],
"panels": [
{
"datasource": "Prometheus",
"fieldConfig": {
"defaults": {
"color": {"mode": "palette-classic"},
"custom": {"axisLabel": "","axisPlacement":"auto","barAlignment": 0,"drawStyle":"line","fillOpacity": 10,"gradientMode":"none","hideFrom": {"graph": false,"legend": false,"tooltip": false,"vis": false},
"lineInterpolation": "linear",
"lineWidth": 1,
"pointSize": 5,
"scaleDistribution": {"type": "linear"},
"showPoints": "never",
"spanNulls": false
},
"mappings": [],
"max": 100,
"min": 0,
"thresholds": {
"mode": "absolute",
"steps": [
{
"color": "green",
"value": null
},
{
"color": "#EAB308",
"value": 70
},
{
"color": "red",
"value": 90
}
]
},
"unit": "percent"
},
"overrides": []
},
"gridPos": {
"h": 9,
"w": 12,
"x": 0,
"y": 0
},
"id": 1,
"options": {
"legend": {
"calcs": [
"mean",
"max"
],
"displayMode": "table",
"placement": "bottom"
},
"tooltip": {"mode": "multi"},
"tooltipOptions": {"mode": "multi"}
},
"targets": [
{"expr": "mongodb_cpu_utilization_percent{instance_name=~\"$instance_name\",instance_id=~\"$instance_id\",role=~\"$role\"}",
"interval": "","legendFormat":"{{instance_name}}-{{instance_id}}-{{role}} CPU","refId":"A"
}
],
"title": "CPU 使用率",
"type": "timeseries"
},
{
"datasource": "Prometheus",
"fieldConfig": {
"defaults": {
"color": {"mode": "palette-classic"},
"custom": {"axisLabel": "","axisPlacement":"auto","barAlignment": 0,"drawStyle":"line","fillOpacity": 10,"gradientMode":"none","hideFrom": {"graph": false,"legend": false,"tooltip": false,"vis": false},
"lineInterpolation": "linear",
"lineWidth": 1,
"pointSize": 5,
"scaleDistribution": {"type": "linear"},
"showPoints": "never",
"spanNulls": false
},
"mappings": [],
"max": 100,
"min": 0,
"thresholds": {
"mode": "absolute",
"steps": [
{
"color": "green",
"value": null
},
{
"color": "#EAB308",
"value": 70
},
{
"color": "red",
"value": 90
}
]
},
"unit": "percent"
},
"overrides": []
},
"gridPos": {
"h": 9,
"w": 12,
"x": 12,
"y": 0
},
"id": 2,
"options": {
"legend": {
"calcs": [
"mean",
"max"
],
"displayMode": "table",
"placement": "bottom"
},
"tooltip": {"mode": "multi"},
"tooltipOptions": {"mode": "multi"}
},
"targets": [
{"expr": "mongodb_memory_utilization_percent{instance_name=~\"$instance_name\",instance_id=~\"$instance_id\",role=~\"$role\"}",
"interval": "","legendFormat":"{{instance_name}}-{{instance_id}}-{{role}} 内存 ","refId":"A"
}
],
"title": "内存使用率",
"type": "timeseries"
},
{
"datasource": "Prometheus",
"fieldConfig": {
"defaults": {
"color": {"mode": "palette-classic"},
"custom": {"axisLabel": "","axisPlacement":"auto","barAlignment": 0,"drawStyle":"line","fillOpacity": 10,"gradientMode":"none","hideFrom": {"graph": false,"legend": false,"tooltip": false,"vis": false},
"lineInterpolation": "linear",
"lineWidth": 1,
"pointSize": 5,
"scaleDistribution": {"type": "linear"},
"showPoints": "never",
"spanNulls": false
},
"mappings": [],
"max": 100,
"min": 0,
"thresholds": {
"mode": "absolute",
"steps": [
{
"color": "green",
"value": null
},
{
"color": "#EAB308",
"value": 70
},
{
"color": "red",
"value": 90
}
]
},
"unit": "percent"
},
"overrides": [
{
"matcher": {
"id": "byName",
"options": "连接"
},
"properties": [
{
"id": "thresholds",
"value": {
"mode": "absolute",
"steps": [
{
"color": "green",
"value": null
},
{
"color": "#EAB308",
"value": 60
},
{
"color": "red",
"value": 85
}
]
}
}
]
}
]
},
"gridPos": {
"h": 9,
"w": 12,
"x": 0,
"y": 9
},
"id": 3,
"options": {
"legend": {
"calcs": [
"mean",
"max"
],
"displayMode": "table",
"placement": "bottom"
},
"tooltip": {"mode": "multi"},
"tooltipOptions": {"mode": "multi"}
},
"targets": [
{"expr": "mongodb_disk_utilization_percent{instance_name=~\"$instance_name\",instance_id=~\"$instance_id\",role=~\"$role\"}",
"interval": "","legendFormat":"{{instance_name}}-{{instance_id}}-{{role}} 磁盘 ","refId":"A"
},
{"expr": "mongodb_iops_utilization_percent{instance_name=~\"$instance_name\",instance_id=~\"$instance_id\",role=~\"$role\"}",
"interval": "","legendFormat":"{{instance_name}}-{{instance_id}}-{{role}} IOPS","refId":"B"
},
{"expr": "mongodb_connection_utilization_percent{instance_name=~\"$instance_name\",instance_id=~\"$instance_id\",role=~\"$role\"}",
"interval": "","legendFormat":"{{instance_name}}-{{instance_id}}-{{role}} 连接 ","refId":"C"
}
],
"title": "磁盘 /IOPS/ 连接使用率",
"type": "timeseries"
},
{
"datasource": "Prometheus",
"fieldConfig": {
"defaults": {
"color": {"mode": "palette-classic"},
"custom": {"axisLabel": "","axisPlacement":"auto","barAlignment": 0,"drawStyle":"line","fillOpacity": 10,"gradientMode":"none","hideFrom": {"graph": false,"legend": false,"tooltip": false,"vis": false},
"lineInterpolation": "linear",
"lineWidth": 1,
"pointSize": 5,
"scaleDistribution": {"type": "linear"},
"showPoints": "never",
"spanNulls": false
},
"mappings": [],
"thresholds": {
"mode": "absolute",
"steps": [
{
"color": "green",
"value": null
},
{
"color": "red",
"value": 80
}
]
},
"unit": "Bps"
},
"overrides": [
{
"matcher": {
"id": "byName",
"options": "内网入流量"
},
"properties": [
{
"id": "unit",
"value": "bytes"
}
]
},
{
"matcher": {
"id": "byName",
"options": "内网出流量"
},
"properties": [
{
"id": "unit",
"value": "bytes"
}
]
}
]
},
"gridPos": {
"h": 9,
"w": 12,
"x": 12,
"y": 9
},
"id": 4,
"options": {
"legend": {
"calcs": [
"mean",
"max"
],
"displayMode": "table",
"placement": "bottom"
},
"tooltip": {"mode": "multi"},
"tooltipOptions": {"mode": "multi"}
},
"targets": [
{"expr": "mongodb_intranet_in_bytes{instance_name=~\"$instance_name\",instance_id=~\"$instance_id\",role=~\"$role\"}",
"interval": "","legendFormat":"{{instance_name}}-{{instance_id}}-{{role}} 内网入流量 ","refId":"A"
},
{"expr": "mongodb_intranet_out_bytes{instance_name=~\"$instance_name\",instance_id=~\"$instance_id\",role=~\"$role\"}",
"interval": "","legendFormat":"{{instance_name}}-{{instance_id}}-{{role}} 内网出流量 ","refId":"B"
}
],
"title": "内网流量",
"type": "timeseries"
},
{
"datasource": "Prometheus",
"fieldConfig": {
"defaults": {
"color": {"mode": "palette-classic"},
"custom": {"axisLabel": "","axisPlacement":"auto","barAlignment": 0,"drawStyle":"line","fillOpacity": 10,"gradientMode":"none","hideFrom": {"graph": false,"legend": false,"tooltip": false,"vis": false},
"lineInterpolation": "linear",
"lineWidth": 1,
"pointSize": 5,
"scaleDistribution": {"type": "linear"},
"showPoints": "never",
"spanNulls": false
},
"mappings": [],
"min": 0,
"thresholds": {
"mode": "absolute",
"steps": [
{
"color": "green",
"value": null
},
{
"color": "#EAB308",
"value": 10
},
{
"color": "red",
"value": 30
}
]
},
"unit": "s"
},
"overrides": []
},
"gridPos": {
"h": 9,
"w": 12,
"x": 0,
"y": 18
},
"id": 5,
"options": {
"legend": {
"calcs": [
"mean",
"max"
],
"displayMode": "table",
"placement": "bottom"
},
"tooltip": {"mode": "multi"},
"tooltipOptions": {"mode": "multi"}
},
"targets": [
{"expr": "mongodb_replication_lag_seconds{instance_name=~\"$instance_name\",instance_id=~\"$instance_id\",role=~\"$role\"}",
"interval": "","legendFormat":"{{instance_name}}-{{instance_id}}-{{role}} 复制延迟 ","refId":"A"
}
],
"title": "复制延迟",
"type": "timeseries"
},
{
"datasource": "Prometheus",
"fieldConfig": {
"defaults": {
"color": {"mode": "palette-classic"},
"custom": {"axisLabel": "","axisPlacement":"auto","barAlignment": 0,"drawStyle":"line","fillOpacity": 10,"gradientMode":"none","hideFrom": {"graph": false,"legend": false,"tooltip": false,"vis": false},
"lineInterpolation": "linear",
"lineWidth": 1,
"pointSize": 5,
"scaleDistribution": {"type": "linear"},
"showPoints": "never",
"spanNulls": false
},
"mappings": [],
"min": 0,
"thresholds": {
"mode": "absolute",
"steps": [
{
"color": "red",
"value": null
},
{
"color": "#EAB308",
"value": 2
},
{
"color": "green",
"value": 6
}
]
},
"unit": "none"
},
"overrides": []
},
"gridPos": {
"h": 9,
"w": 12,
"x": 12,
"y": 18
},
"id": 6,
"options": {
"legend": {
"calcs": [
"mean",
"min"
],
"displayMode": "table",
"placement": "bottom"
},
"tooltip": {"mode": "multi"},
"tooltipOptions": {"mode": "multi"}
},
"targets": [
{"expr": "mongodb_number_requests_total{instance_name=~\"$instance_name\",instance_id=~\"$instance_id\",role=~\"$role\"}",
"interval": "","legendFormat":"{{instance_name}}-{{instance_id}}-{{role}} 请求数 ","refId":"A"
},
{"expr": "mongodb_connection_amount_total{instance_name=~\"$instance_name\",instance_id=~\"$instance_id\",role=~\"$role\"}",
"interval": "","legendFormat":"{{instance_name}}-{{instance_id}}-{{role}} 连接数 ","refId":"B"
}
],
"title": "请求数 / 连接数",
"type": "timeseries"
},
{
"datasource": "Prometheus",
"fieldConfig": {
"defaults": {
"color": {"mode": "palette-classic"},
"custom": {"axisLabel": "","axisPlacement":"auto","barAlignment": 0,"drawStyle":"line","fillOpacity": 10,"gradientMode":"none","hideFrom": {"graph": false,"legend": false,"tooltip": false,"vis": false},
"lineInterpolation": "linear",
"lineWidth": 1,
"pointSize": 5,
"scaleDistribution": {"type": "linear"},
"showPoints": "never",
"spanNulls": false
},
"mappings": [],
"min": 0,
"thresholds": {
"mode": "absolute",
"steps": [
{
"color": "green",
"value": null
},
{
"color": "red",
"value": 80
}
]
},
"unit": "ops"
},
"overrides": []
},
"gridPos": {
"h": 9,
"w": 12,
"x": 0,
"y": 27
},
"id": 7,
"options": {
"legend": {
"calcs": [
"mean",
"max"
],
"displayMode": "table",
"placement": "bottom"
},
"tooltip": {"mode": "multi"},
"tooltipOptions": {"mode": "multi"}
},
"targets": [
{"expr": "mongodb_qps_total{instance_name=~\"$instance_name\",instance_id=~\"$instance_id\",role=~\"$role\"}",
"interval": "","legendFormat":"{{instance_name}}-{{instance_id}}-{{role}} QPS","refId":"A"
},
{"expr": "mongodb_op_insert_total{instance_name=~\"$instance_name\",instance_id=~\"$instance_id\",role=~\"$role\"}",
"interval": "","legendFormat":"{{instance_name}}-{{instance_id}}-{{role}} Insert","refId":"B"
},
{"expr": "mongodb_op_update_total{instance_name=~\"$instance_name\",instance_id=~\"$instance_id\",role=~\"$role\"}",
"interval": "","legendFormat":"{{instance_name}}-{{instance_id}}-{{role}} Update","refId":"C"
},
{"expr": "mongodb_op_delete_total{instance_name=~\"$instance_name\",instance_id=~\"$instance_id\",role=~\"$role\"}",
"interval": "","legendFormat":"{{instance_name}}-{{instance_id}}-{{role}} Delete","refId":"D"
},
{"expr": "mongodb_op_query_total{instance_name=~\"$instance_name\",instance_id=~\"$instance_id\",role=~\"$role\"}",
"interval": "","legendFormat":"{{instance_name}}-{{instance_id}}-{{role}} Query","refId":"E"
}
],
"title": "QPS / 读写操作",
"type": "timeseries"
},
{
"datasource": "Prometheus",
"fieldConfig": {
"defaults": {
"color": {"mode": "palette-classic"},
"custom": {"axisLabel": "","axisPlacement":"auto","barAlignment": 0,"drawStyle":"line","fillOpacity": 10,"gradientMode":"none","hideFrom": {"graph": false,"legend": false,"tooltip": false,"vis": false},
"lineInterpolation": "linear",
"lineWidth": 1,
"pointSize": 5,
"scaleDistribution": {"type": "linear"},
"showPoints": "never",
"spanNulls": false
},
"mappings": [],
"min": 0,
"thresholds": {
"mode": "absolute",
"steps": [
{
"color": "green",
"value": null
},
{
"color": "red",
"value": 80
}
]
},
"unit": "ops"
},
"overrides": [
{
"matcher": {
"id": "byName",
"options": "活跃会话数"
},
"properties": [
{
"id": "unit",
"value": "short"
}
]
}
]
},
"gridPos": {
"h": 9,
"w": 12,
"x": 12,
"y": 27
},
"id": 8,
"options": {
"legend": {
"calcs": [
"mean",
"max"
],
"displayMode": "table",
"placement": "bottom"
},
"tooltip": {"mode": "multi"},
"tooltipOptions": {"mode": "multi"}
},
"targets": [
{"expr": "mongodb_op_getmore_total{instance_name=~\"$instance_name\",instance_id=~\"$instance_id\",role=~\"$role\"}",
"interval": "","legendFormat":"{{instance_name}}-{{instance_id}}-{{role}} Getmore","refId":"A"
},
{"expr": "mongodb_op_command_total{instance_name=~\"$instance_name\",instance_id=~\"$instance_id\",role=~\"$role\"}",
"interval": "","legendFormat":"{{instance_name}}-{{instance_id}}-{{role}} Command","refId":"B"
},
{"expr": "mongodb_connection_amount_total{instance_name=~\"$instance_name\",instance_id=~\"$instance_id\",role=~\"$role\"}",
"interval": "","legendFormat":"{{instance_name}}-{{instance_id}}-{{role}} 连接数 ","refId":"C"
}
],
"title": "Getmore / Command / 连接数",
"type": "timeseries"
}
],
"schemaVersion": 27,
"style": "dark",
"tags": [
"aliyun",
"mongodb",
"replicaset"
],
"templating": {
"list": [
{"allValue": "","current": {"selected": false,"text":"All","value":"$__all"},"datasource":"Prometheus","definition":"label_values(mongodb_cpu_utilization_percent, instance_name)","description":" 选择 MongoDB 实例名称 ","error": null,"hide": 0,"includeAll": true,"label":" 实例名称 ","multi": true,"name":"instance_name","options": [],"query": {"query":"label_values(mongodb_cpu_utilization_percent, instance_name)","refId":"StandardVariableQuery"},"refresh": 1,"regex":"",
"skipUrlSync": false,
"sort": 5,
"tagValuesQuery": "","tags": [],"tagsQuery":"",
"type": "query",
"useTags": false
},
{
"allValue": null,
"current": {
"selected": false,
"text": "All",
"value": "$__all"
},
"datasource": "Prometheus",
"definition": "label_values(mongodb_cpu_utilization_percent{instance_name=~\"$instance_name\"}, instance_id)",
"description": "选择 MongoDB 实例 ID",
"error": null,
"hide": 0,
"includeAll": true,
"label": "实例 ID",
"multi": true,
"name": "instance_id",
"options": [],
"query": {"query": "label_values(mongodb_cpu_utilization_percent{instance_name=~\"$instance_name\"}, instance_id)",
"refId": "StandardVariableQuery"
},
"refresh": 1,
"regex": "","skipUrlSync": false,"sort": 5,"tagValuesQuery":"",
"tags": [],
"tagsQuery": "","type":"query","useTags": false
},
{
"allValue": null,
"current": {
"selected": false,
"text": "All",
"value": "$__all"
},
"datasource": "Prometheus",
"definition": "label_values(mongodb_cpu_utilization_percent{instance_name=~\"$instance_name\",instance_id=~\"$instance_id\"}, role)",
"description": "选择角色(Primary/Secondary)",
"error": null,
"hide": 0,
"includeAll": true,
"label": "角色",
"multi": true,
"name": "role",
"options": [],
"query": {"query": "label_values(mongodb_cpu_utilization_percent{instance_name=~\"$instance_name\",instance_id=~\"$instance_id\"}, role)",
"refId": "StandardVariableQuery"
},
"refresh": 1,
"regex": "","skipUrlSync": false,"sort": 5,"tagValuesQuery":"",
"tags": [],
"tagsQuery": "","type":"query","useTags": false
}
]
},
"time": {
"from": "now-1h",
"to": "now"
},
"timepicker": {},
"timezone": "","title":" 阿里云 MongoDB 副本集监控仪表板 ","uid":"aliyun-mongodb-dashboard","version": 1
}实现效果如下

微信扫描下方的二维码阅读本文

正文完