共计 1983 个字符,预计需要花费 5 分钟才能阅读完成。
prometheus 监控自建 redis 并实现报警
周末因为一台 redis 代码链接 redis oom 所以需要进行相关监控
报错内容如下:org.springframework.beans.factory.annotation.InitDestroyAnnotationBeanPostProcessor.postProcessBeforeInitialization(InitDestroyAnnotationBeanPostProcessor.) ... 40 common frames omitted Caused by: io.lettuce.core.RedisCommandExecutionException: OOM command not allowed when used memory > 'maxmemory'.
临时解决办法
CONFIG SET maxmemory 2gb原因是我 redis 的最大内存设置了 1G,同时代码没有设置 key 的过期时间导致,设置成功后开发进行相关 bug 修复。
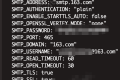
一,redis 客户端配置 虽然问题解决但是我们还是需要配置监控主动报警。配置的监控的过程如下。首先下载 redis_exporter
wget https://github.com/oliver006/redis_exporter/releases/download/v1.63.0/redis_exporter-v1.63.0.linux-amd64.tar.gz然后配置 redis 启动
vim /lib/systemd/system/redis_exporter.service
[Unit]
Description=Redis exporter
After=network.target

[Service]
User=dev
Group=dev
ExecStart=/opt/apps/redis_exporter/redis_exporter -redis.addr 127.0.0.1:6379
Type=simple

[Install]
WantedBy=multi-user.target

加载配置
systemctl daemon-reload
启动
systemctl start redis_exporter
开机自启
systemctl enable redis_exporter
二,prometheus 服务端配置
  - job_name: 'redis_exporter'
    file_sd_configs:
      - files:
          - /usr/local/prometheus/configs/redis_exporter.yml
然后配置 redis_exporter.yml
- targets:
    - '你 redis_exporter 的 ip:9121'
设置报警规则我们需要到 prometheus 的报警规则下加上相关报警规则
cat redis.yml
groups:
- name: redis
  rules:
    - alert: RedisDown
      expr: redis_up == 0
      for: 30s
      labels:
        severity: critical
      annotations:
        summary: "Redis down (instance {{ $labels.instance}})"
        description: "Redis 挂了 \n  VALUE = {{$value}}\n  LABELS: {{$labels}}"
    - alert: RedisOutOfMemory
      expr: redis_memory_used_bytes / redis_total_system_memory_bytes * 100 > 90
      for: 60s
      labels:
        severity: warning
      annotations:
        summary: "Redis out of memory (instance {{ $labels.instance}})"
        description: "Redis 内存不足 (> 90%)\n  VALUE = {{$value}}\n  LABELS: {{$labels}}"
    - alert: RedisTooManyConnections
      expr: redis_connected_clients > 100
      for: 30s
      labels:
        severity: warning
      annotations:
        summary: "Redis too many connections (instance {{ $labels.instance}})"
        description: "Redis 实例连接过多 \n  VALUE = {{$value}}\n  LABELS: {{$labels}}"
这样基本我们就完成了,如果需要监控更多实例只需要安装 redis_exporter 并把配置加到 redis_exporter.yml 就能识别监控相关实例了。
最后在 grafana 倒入表盘 id 就能查看相关监控信息了。
我用的 id 是 18345 效果图如下:

微信扫描下方的二维码阅读本文